Google's Test Window for New Posts: 80 Days of GSC Data
In 80 days of our own daily Search Console data, our two most-tested new posts were shown for 126 to 290 broad queries at positions 40-70 for about five weeks, earned no clicks there, then were cut back to a trickle near positions 5-15.
In our own daily Google Search Console data, the test window for new posts looks like this on travelpointsmath.com, the one site with enough volume to show it: a post gets its first impressions 1 to 4 days after publishing, is then shown for a broad set of queries at positions 40 to 70 for about five weeks, earns no clicks there, and is then cut back to a trickle of impressions near positions 5 to 15. On travelpointsmath.com, the Chase transfer guide was shown for 290 distinct visible queries between June 30 and August 3, 2026, at an average position of 59.0, with zero clicks. Across August 3 to 6, the site's visible queries fell from about 26 a day in the week before to 3 a day in the week after. Our September posts looked like they debuted higher, but only in hidden (anonymized) queries. Their visible queries still started at positions 54 to 65.
Google does not publish a named test phase for new pages. "Test window" is our label for a pattern we can see in the numbers. This page reports what four small sites we own (travelpointsmath.com, lastingcontent.com, billcleanup.com and visitorops.com) show, with dates and counts, and it marks where the data stops.
What does the data cover?
We pulled daily Search Console rows for four domain properties on 2026-09-15, for 2026-06-20 to 2026-09-14. The first rows appear on 2026-06-27, so the series is 80 days long. Across all four properties there were 3,407 impressions and 3 clicks.
| Property | Impressions / clicks | Visible queries: impr. (pos.) | Hidden queries: impr. (pos.) |
|---|---|---|---|
| travelpointsmath.com | 3,040 / 2 | 1,523 (53.7) | 1,517 (38.7) |
| lastingcontent.com | 135 / 0 | 71 (77.8) | 64 (44.6) |
| billcleanup.com | 73 / 0 | 16 (49.6) | 57 (19.6) |
| visitorops.com | 159 / 1 | 54 (67.7) | 105 (6.7) |
"Visible" means Search Console reported the query. "Hidden" means the impressions are in the site total but Search Console did not report a query for them. Google's performance-data deep dive explains that queries issued by very few people are anonymized and left out of query rows. On all four sites, hidden-query impressions sat much higher on the page than visible-query impressions. That gap matters for everything below.
travelpointsmath.com holds 89% of the impressions, so most of the pattern comes from one site and four of its guides. Every number on this page is in the public dataset, with daily rows for each site and each URL.
What does Google's test window look like day by day?
On travelpointsmath.com it looks like two waves of broad impressions, each ended by an abrupt cut. The first wave ran from June 30 to August 2. The cut came between August 3 and August 6. A smaller re-test ran from August 20 to August 31, and a second cut came on September 1.
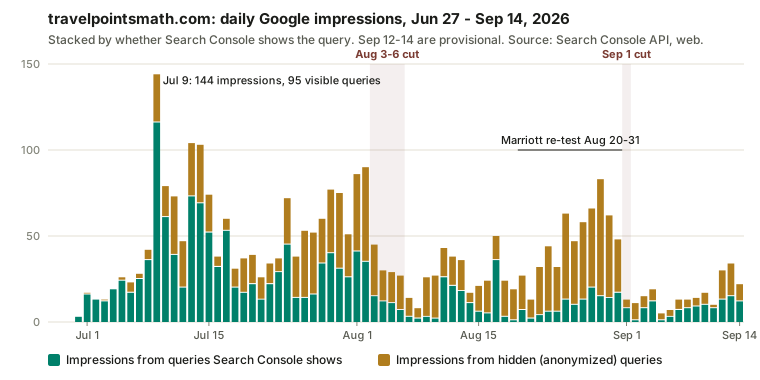
Chart 1. travelpointsmath.com daily impressions, split by whether Search Console shows the query. Built from summary.json.
| travelpointsmath.com window | Impr. per day / clicks | Avg. pos. | Visible queries |
|---|---|---|---|
| Jun 30 - Aug 2 (34 days): first broad wave | 51.9 / 1 | 50.2 | 509 |
| Aug 3 - Aug 19 (17 days): after the first cut | 28.1 / 0 | 29.5 | 54 |
| Aug 20 - Aug 31 (12 days): re-test | 47.9 / 0 | 52.3 | 94 |
| Sep 1 - Sep 14 (14 days): after the second cut | 15.9 / 1 | 34.3 | 77 |
The peak day was July 9: 144 impressions from 95 visible queries. Look at the average-position column. It "improves" from 50.2 to 29.5 after the first cut because the deep, broad impressions disappear, not because the pages moved up. The impressions that stayed were already higher on the page.
How long did the broad test last, and where did the posts rank?
For the two travelpointsmath.com guides with the most data, the broad test lasted about five weeks, at positions near 40 to 70, with no clicks from the deep impressions.
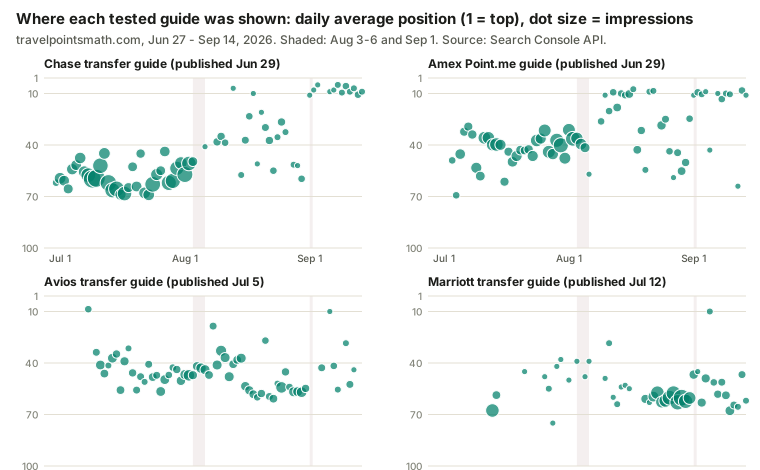
Chart 2. Daily average position for the four guides that were tested. A dot near 60 with a large radius is a broad-test day. Small dots near 10 after September 1 are the foothold.
| Guide (published, first seen) | Broad phase | Impr. / visible queries | Avg. pos. / clicks |
|---|---|---|---|
| Chase transfer (Jun 29, Jun 30) | Jun 30 - Aug 3 (35 days) | 909 / 290 | 59.0 / 0 |
| Amex Point.me (Jun 29, Jul 3) | Jul 3 - Aug 5 (34 days) | 526 / 126 | 40.5 / 1 |
| Avios transfer (Jul 5, Jul 8) | Jul 8 - Aug 31 (55 days, lower volume) | 360 / 53 | 46.4 / 0 |
| Marriott transfer (Jul 12, Jul 13) | Aug 20 - 31 re-test (12 days) | 295 / 71 | 60.5 / 0 |
We call the end of a broad phase the last day with three or more visible queries before the page stopped getting them. For Chase that was August 3, and for Amex it was August 5. The Avios guide does not fit the five-week shape. It stayed at 4 to 8 impressions a day at positions 40 to 60 for about eight weeks and had no rows at all from September 1 to 3. The Marriott guide had a two-day debut burst (26 impressions from 20 visible queries on July 13, at position 67.7), about five quiet weeks with less than one impression a day, and then a 12-day re-test.
The broad queries were real queries, not noise. The top Chase queries in the first wave were "how to transfer chase points to japan airlines" (21 impressions, position 47.5), "how to transfer chase points" (18, position 52.9) and "chase points partner airlines" (17, position 76.4). The guide was shown for head terms it could not compete for yet.
What happened on August 3-6 and September 1?
Both cuts were abrupt. Only one of them had no change on our side.
| Cut | 7 days before | 7 days after | Site changes near the cut |
|---|---|---|---|
| Aug 3 - 6 | Jul 27 - Aug 2: 70.1 impressions/day, 25.7 visible queries/day | Aug 7 - 13: 27.4 impressions/day, 3.0 visible queries/day | None. The travelpointsmath.com repository has no commits between July 23 and August 31. |
| Sep 1 | Aug 25 - 31: 61.0 impressions/day, 13.3 visible queries/day | Sep 1 - 7: 11.9 impressions/day, 5.4 visible queries/day | On August 31 we edited the Amex, Avios, JetBlue and Marriott guides and changed SEO metadata code. We published 12 new guides on September 1 and 2. |
Day by day, the first cut went from 90 impressions and 31 visible queries on August 2 to 45 and 15 on August 3, 30 and 12 on August 4, 29 and 9 on August 5, 27 and 6 on August 6, and 14 and 3 on August 7. The second cut went from 48 impressions on August 31 to 13 on September 1. The Marriott guide fell from 22 to 8 that day.
We also checked Google's Search Status Dashboard. It lists no ranking incident for early August or September 1, 2026. It lists an August 2026 spam update that started on August 18 and ran for 2 days and 16 hours. The Marriott re-test started on August 20, near the end of that rollout. That is a coincidence in time. The data cannot show that one caused the other.
Did any test-window impressions turn into clicks?
No clicks came from the deep broad-test impressions. In 80 days, the four sites got 3 clicks in total.
| Date | Page | Position at the click |
|---|---|---|
| Jul 8 | travelpointsmath.com Amex Point.me guide | 12.3 for the query "amex point me" |
| Sep 9 | travelpointsmath.com Air France award guide | 8 (1 impression that day) |
| Sep 11 | visitorops.com email-sequence guide | 6 (1 impression that day) |
The Chase guide got 909 impressions in its broad phase and zero clicks. The Marriott guide got 295 impressions in its re-test and zero clicks. Every click came from a position between 6 and 12.3. With 3 clicks, this is not a click-through-rate estimate. It only shows that the 40 to 70 range produced nothing for us.
What is left after the cut: a foothold or nothing?
For the two July guides, what stayed was a small foothold: one or two impressions a day, almost all from hidden queries, near the top of page one.
- Chase guide. From September 1 to 14 it got 21 impressions at an average position of 8.0, with no visible query. Between the cut and August 31 it averaged about 2 impressions a day at an average position near 39.
- Amex guide. From September 1 to 14 it got 21 impressions at position 14.4. The 20 hidden-query impressions averaged 11.9. The one visible query was at 64.
- Avios guide. It faded rather than settled. It had 17 impressions from September 1 to 14 at position 42.8.
- Marriott guide. It has not settled yet. After September 1 it still got 4.6 impressions a day from 37 distinct visible queries, which averaged position 60.1.
We cannot see the foothold queries, because Search Console hides them. So "long-tail foothold" is an inference from two facts: the queries are too rare to be reported, and they rank near the top. We cannot name them.
Did the September posts debut higher than the July posts?
Only in hidden queries. The visible queries of September posts debuted as deep as the July posts did, and September posts took longer to be seen at all. "Median lag" is the median number of days from publishing to first impression.
| Cohort, by publish date | Seen by Sep 14; median lag | Visible, first 3 days: impr. (pos.) | Hidden, first 3 days: impr. (pos.) |
|---|---|---|---|
| travelpointsmath.com, Jun 29 - Jul 23 | 9 of 9; 3 days | 76 (62.2) | 25 (32.2) |
| travelpointsmath.com, Sep 1 - 5 | 10 of 17; 10 days | 29 (60.7) | 33 (9.1) |
| lastingcontent.com, Sep 1 - 5 | 8 of 19; 7 days | 6 (53.7) | 9 (7.6) |
| visitorops.com, Sep 1 - 5 | 28 of 57; 4 days | 31 (64.8) | 37 (7.3) |
| billcleanup.com, Sep 1 - 5 | 0 of 30 | 0 | 0 |
Earlier notes of ours said the September cohort "debuted at positions 4 to 20". That is true for the hidden-query impressions. It is not true for the visible queries, which started at positions 54 to 65, the same depth as July. The median days to first impression on travelpointsmath.com went from 3 in July to 10 in September. None of billcleanup.com's 30 September posts had an impression 9 to 13 days after publication.
On lastingcontent.com, the July posts never got a broad wave. Its four July posts got 84 impressions in about 11 weeks, with a median of 17 days to first impression. This data cannot tell us why.
How can you read the test window in your own Search Console data?
Use daily rows, not a 28-day average, and read each phase from the signals below. The examples are our measured values. They are not thresholds from Google.
| Phase | What the daily rows show | Our measured example | What to do |
|---|---|---|---|
| Discovery lag | Days from publish to first impression | July: median 3 days (travelpointsmath.com). September: median 4 to 10 days. billcleanup.com: 0 of 30 seen after 9 to 13 days | Do not judge the post yet. Confirm the URL is indexed if it has no impressions. |
| Broad test | Many visible queries per day, positions 40 to 70, no clicks | Chase guide, Jun 30 - Aug 3: 909 impressions, 290 visible queries, position 59.0, 0 clicks | Wait. Log the date. Do not rewrite for head terms the post shows up for at position 60. |
| Cut | Visible queries per day fall by most of their volume within about four days | travelpointsmath.com, Aug 3 - 6: 25.7 to 3.0 visible queries a day | Record the date and check your change log for edits near it. |
| Foothold | About 1 to 2 impressions a day, almost all hidden, positions 5 to 15 | Chase guide, Sep 1 - 14: 21 impressions at position 8.0 | Read this as the post's current competitive range. Improve the post for its core task. |
| Re-test | Broad visible queries return weeks later | Marriott guide, Aug 20 - 31: 295 impressions, 71 visible queries, position 60.5 | Treat it as a new broad test. Do not edit mid-test if you want a clean reading. |
| No test | A trickle of impressions, mostly hidden, no broad wave | lastingcontent.com July posts: 84 impressions in about 11 weeks | The daily data cannot tell you the cause. Do not assume rewriting will start a test. |
To build this view, pull date, date+page and date+query rows from the Search Analytics API. Subtract visible-query impressions from the site total for each day to get hidden impressions, and keep a dated log of every edit you make to the post.
What should an operator do with this?
Change how you judge new posts, not how many you write. These steps follow from the numbers above. They are not a guarantee of any outcome.
- Wait for the cut before you judge a new post. The two clean broad tests lasted 34 and 35 days. A review at day 14 would have caught the Chase guide in the middle of a broad phase that averaged 26.0 impressions a day, and could have read it as a rising page. Our September posts took a median of 4 to 10 days to get a first impression, so a review before about week 6 or 7 is early for them.
- Split visible from hidden impressions before you read average position. The Chase guide's average position went from 59.0 to 8.0 while its impressions fell from 26.0 a day to 1.5 a day. That is survivorship, not a ranking gain.
- Log every edit with a date, and avoid edits during a test. We edited four tested guides on August 31. We cannot separate that edit from the September 1 cut, and we lost a clean reading because of it.
- Do not rewrite titles for broad-test impressions. Our clicks came only from positions 6 to 12.3. Impressions at position 60 are not demand a title can capture. The order in our impressions-without-clicks guide applies: fix rank and fit before copy.
- Put your next action into one line. Pull daily date, date+page and date+query rows for your newest posts, split visible from hidden impressions, and mark each post's test start, cut date and foothold position before you rewrite, merge or republish it. Put those dates in your content maintenance calendar as review triggers.
If you want a structured keep, cut, merge or refresh call after the test ends, the content durability scorer and the AI Overviews content audit are the next steps. For posts whose value is not in clicks at all, see how to measure AI search visibility when clicks are not the whole story.
How was this data collected and processed?
The method is simple, and every step can be repeated.
- Source. Google Search Console Search Analytics API (
searchanalytics.query), search typeweb,dataState: all, for the domain properties sc-domain:travelpointsmath.com, sc-domain:lastingcontent.com, sc-domain:billcleanup.com and sc-domain:visitorops.com. - Pull. Run on 2026-09-15 at 10:44 UTC for 2026-06-20 to 2026-09-14, with 25,000-row pages. No request reached the row limit. The largest was 1,239 date+page+query rows for travelpointsmath.com.
- Dimensions. date; date+page; date+query; date+page+query.
- Hidden impressions. For each day, the site total minus the sum of visible-query impressions. The hidden-query position is derived as (total impressions x position minus the sum of visible impressions x position) divided by hidden impressions. For a single page, we used date+page+query rows the same way.
- Positions. Search Console reports the topmost position of a link to the page, averaged across impressions. All multi-day positions on this page are weighted by impressions.
- Publish dates. From each guide's
publishedAtfrontmatter in the site repositories. We matched URLs by slug, so www. and apex versions of the same guide count as one post. - Window edges. We read the edges off the daily table (Chart 1). They are not the output of a statistical change-point test.
- Site changes. From the commit history of each site repository.
The published summary.json holds the daily series for each property, daily rows for each URL, the window and cohort tables, the top queries for the tested guides, and every click event.
What can this data not tell you?
It cannot tell you why Google did what it did, and it may not describe your site.
- Small sites, small numbers. There are 3,407 impressions and 3 clicks. One site holds 89% of the impressions, and the five-week shape rests on two guides. Treat it as a case study, not a benchmark.
- Recent days can change. We pulled with
dataState: all, which includes fresh data. Google says the newest data can be preliminary. Treat September 12 to 14 as provisional. The September cohort had at most 13 days to be seen. - Half the queries are hidden. 1,517 of travelpointsmath.com's 3,040 impressions have no reported query. The foothold description depends on data we cannot see.
- Position is an average. A page-day at position 8 can be one impression at 8.
- Duplicate hosts. Until a redirect shipped on September 13, travelpointsmath.com also served www. URLs, and Google reported all 62 of its September-cohort impressions on them. Some July URLs appear on both hosts.
- Correlation, not cause. The September 1 cut came one day after our own edits and during a 12-post batch. The August re-test started near the end of a Google spam update. The August 3 to 6 cut had no change on our side, but Google-side changes that are not listed as incidents would not be visible to us.
Claim ledger
| Claim | Source | How we use it |
|---|---|---|
| Search Console position is the topmost position of a link to the property or page, averaged across queries. | Google Search Console Help, "What are impressions, position, and clicks?", accessed 2026-09-15. | We weight all multi-day positions by impressions and warn that a daily average can be one impression. |
| Queries issued by very few users are anonymized and left out of query rows, while totals still include them. | Google Search Central Blog, "A deep dive into Search Console performance data filtering and limits", October 2022, accessed 2026-09-15. | Basis for the hidden-impressions calculation. |
| The newest performance data can be preliminary and may change. | Google Search Console Help, Performance report (Search results), accessed 2026-09-15. | We mark September 12 to 14 as provisional. |
dataState: all includes fresh data, and the API returns top rows rather than every row. |
Search Console API reference, searchanalytics.query, accessed 2026-09-15. | Pull settings, and the note that no request reached the row limit. |
| The August 2026 spam update started on 18 Aug 2026 and ran for 2 days and 16 hours. No incident is listed for early August or September 1. | Google Search Status Dashboard, ranking incident history, accessed 2026-09-15. | Timing context for the re-test and both cuts. Not a cause. |
| All window, cohort, and click counts on this page. | Our own dated dataset, summary.json, pulled 2026-09-15. | Every table on this page can be checked against it. |
FAQ
How long does Google test new content?
In our data, the two clearest broad tests lasted 34 and 35 days: the Chase guide (June 30 to August 3, 2026) and the Amex guide (July 3 to August 5). A third guide stayed in a lower-volume test for about eight weeks. A re-test of a fourth guide lasted 12 days. Google does not publish a fixed length.
Is the Google honeymoon period real?
What we see is not a honeymoon of high rankings. Our new posts were shown at positions 40 to 70 for broad queries, which is a test at the bottom, not a boost at the top. The impressions fell sharply after about five weeks. The positions the Chase and Amex guides kept afterward were near 8 and 14, but for about 1.5 impressions a day each.
Why did my new post's impressions drop after a few weeks?
In our data, drops like this matched the end of a broad test: visible queries per day on travelpointsmath.com fell from 25.7 to 3.0 between the week before August 3 and the week after August 6. Check whether the lost impressions were at positions 40 to 70 and whether any edits happened near the drop date before you rewrite anything.
Does average position improve after the drop?
It can look that way, but not because the page moved. When the deep impressions disappear, the average is made only from the impressions that stay, which were already higher. The Chase guide went from position 59.0 in its broad phase to 8.0 from September 1 to 14, while its daily impressions fell from 26.0 to 1.5.
Should I rewrite a new post while Google is testing it?
We do not recommend it if you want to learn from the test. We edited four guides on August 31, and the next day's cut cannot be separated from that edit. Let the test end, record the foothold, and then decide.
Sources
- Google Search Console Help, What are impressions, position, and clicks?: https://support.google.com/webmasters/answer/7042828
- Google Search Console Help, Performance report (Search results): https://support.google.com/webmasters/answer/7576553
- Google Search Central Blog, A deep dive into Search Console performance data filtering and limits (October 2022): https://developers.google.com/search/blog/2022/10/performance-data-deep-dive
- Google Search Console API, Search Analytics query reference: https://developers.google.com/webmaster-tools/v1/searchanalytics/query
- Google Search Status Dashboard, ranking incident history: https://status.search.google.com/products/rGHU1u87FJnkP6W2GwMi/history
- Our own dated dataset, daily Search Console rows for travelpointsmath.com, lastingcontent.com, billcleanup.com and visitorops.com, 2026-06-27 to 2026-09-14, pulled 2026-09-15: https://lastingcontent.com/research/gsc-test-window/summary.json
Sources
- https://support.google.com/webmasters/answer/7042828
- https://support.google.com/webmasters/answer/7576553
- https://developers.google.com/search/blog/2022/10/performance-data-deep-dive
- https://developers.google.com/webmaster-tools/v1/searchanalytics/query
- https://status.search.google.com/products/rGHU1u87FJnkP6W2GwMi/history
- writer-created dated dataset, daily Search Console rows for four owned properties, 2026-06-27 to 2026-09-14